Introduction
In this blog series, I am investigating recycling rates in England. In Part 1 I described why I wanted to conduct this analysis. In Part 2 I described my progress to date. In this final instalment, I present the results.
Context
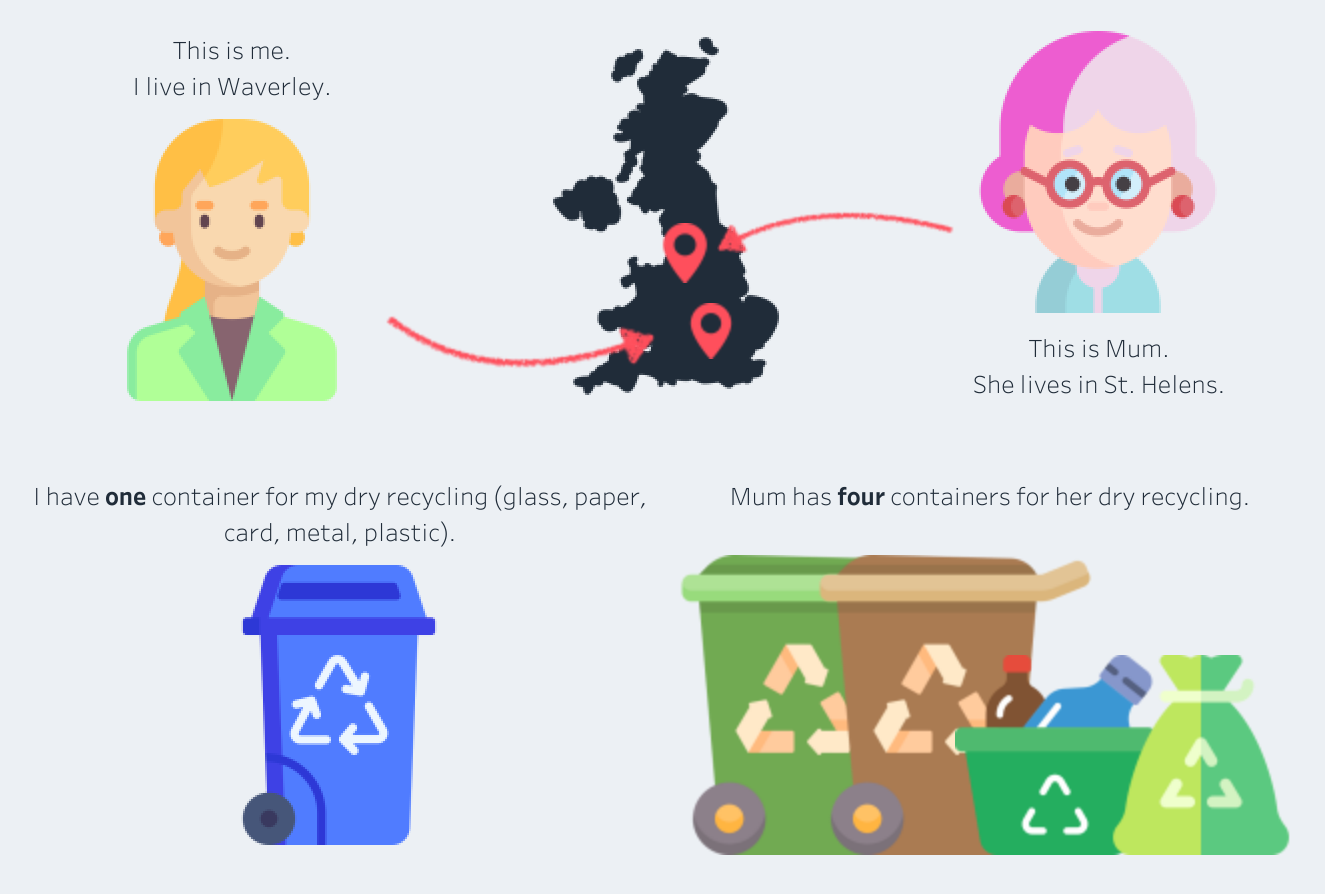
Recently, I had a conversation with my mum about the number of different containers she has to sort her household recycling into. I live in Waverley, and in my house we have just one recycling bin, but Mum, who lives in St Helens, has four. When you include general waste, garden waste and food waste, I have four bins and Mum has seven. This got us thinking:
If you have more bins, do you end up recycling more overall?
Mum and I looked up the latest recycling rates for Waverley and St Helens and were surprised to discover that St Helens, with its multi-stream system, recycled just 36.8% of household waste in FY2021/22, compared to Waverley, with its co-mingled system which achieved 58.9% in the same period (source: Defra).
In the UK, local authorities are required by law to collect at least two different types, or streams, of recyclable materials from households. The five most common materials to be collected are:
- Cardboard
- Glass
- Metal
- Paper
- Plastic
In a co-mingled system, the burden of separating the materials lies with the local authority, and is usually achieved by sending the combined recyclable waste to a materials recovery facility. In a multi-stream, or kerbside sort, system, the burden of separation lies with the householder, and as my Mum can attest, it can be onerous and confusing.
So, if Mum is spending so much time and effort to separate her recycling, and her local authority is under-performing on recycling rates, why bother going to all that effort?
Methodology
To answer the question, I collected data about recycling systems and rates for all 309 local authorities in England in 2021. Recycling rates for each local authority are published by Defra using the WasteDataFlow web-based reporting system. At the time of conducting this research, the most recent figures available were for the 2021-2022 financial year. Recycling rates were calculated by taking the volume of household waste sent for recycling, composting or reuse by the total volume of household waste collected. Non-household waste was not included in this research.
Details of the type of recycling system in place (co-mingled, two-stream or multi-stream) in each local authority were not easily available. I could not find a public data source for this information, so I took a two-pronged approach to obtain it. First, I launched a Google Forms survey, which asked respondents to provide the name of their local authority, whether they had household or communal waste collection and how many containers they had for recyclable materials. I launched the survey within my social networks and on SurveyCircle. In parallel, I submitted a Freedom of Information (FOI) request to Defra to obtain the data. The survey collected 41 responses and provided some interesting insights into peoples’ thoughts and concerns with their recycling collections. Ultimately, the FOI request provided me with a consistent and verified source of the data I needed. I have published the results and data from the FOI request here.
Data overview
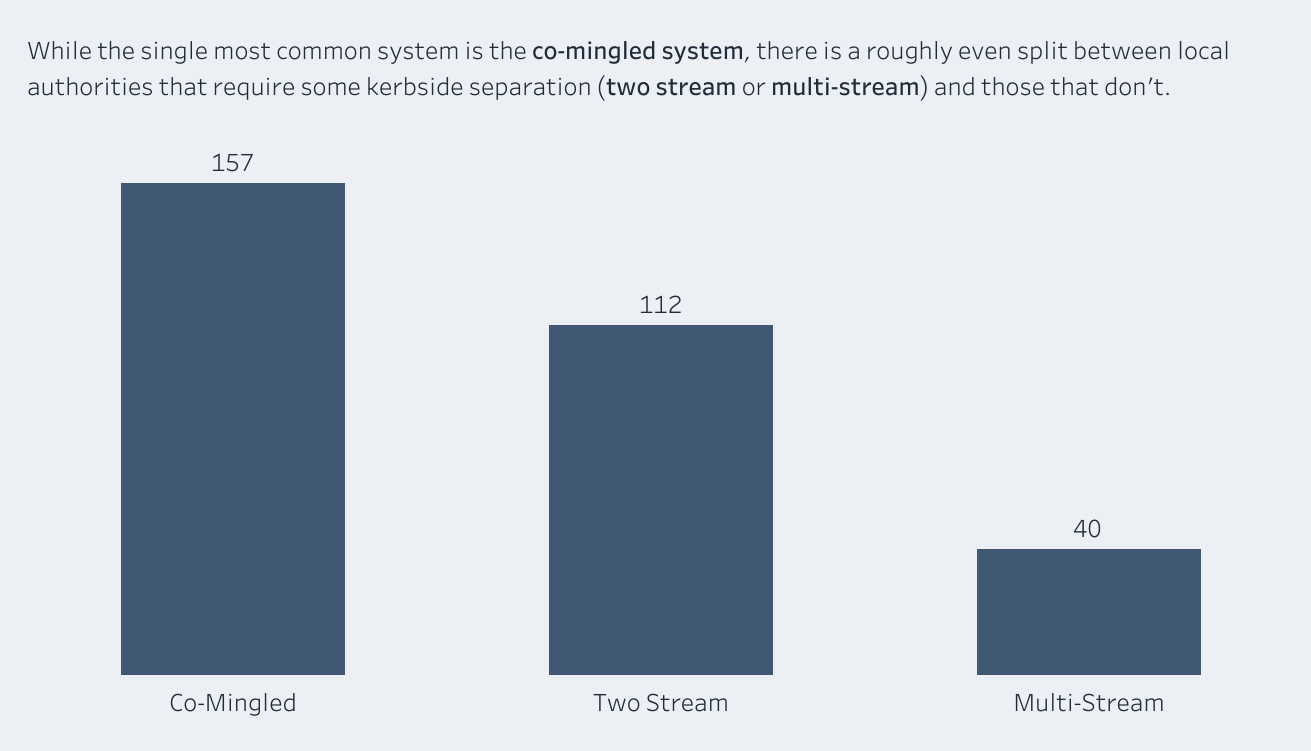
My dataset consists of recycling data from 309 local authorities in England. Of these, 157 use a co-mingled system, 112 use a two-stream system and 40 use a multi-stream system.
Key findings
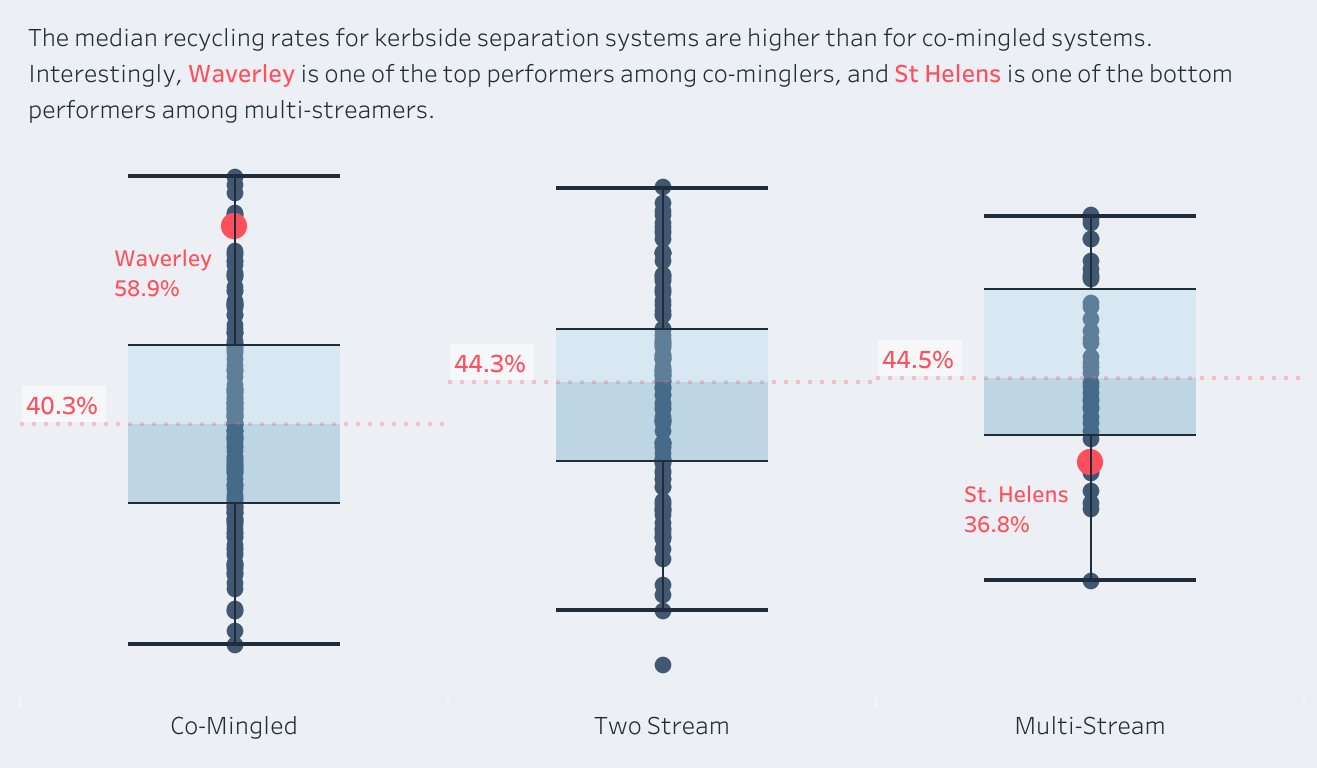
Local authorities employing a co-mingled system achieved a median recycling rate of 40.3%, while those employing two-stream or multi-stream systems achieved higher rates of 44.3% and 44.5% respsectively. This indicates a difference in recycling rates in favour of one of the kerbside sort systems. It is interesting to note that the local authority with the highest recycling rate in 2021 was Three Rivers (63.5%), which uses a co-mingled system. The lowest performer overall was Barrow-in-Furness (17.7%), which uses a two-stream system.
Looking specifically at Waverley and St Helens, we see that Waverley is one of the top performers amongst co-minglers and St Helens is one of the bottom performers among multi-streamers.
Discussion
The higher recycling rates in kerbside sort systems could be attributed to better sorting at source, leading to cleaner recyclables. Additionally, community awareness and engagement may play a role. However, as the data shows, local authorities using a co-mingled system can and do achieve high recycling rates, with less burden on the householder.
Limitations
It is important to note that my research focussed only on data from a single financial year and is only applicable to local authorities in England. Furthermore, the analysis does not account for differences in the materials collected for recycling in different local authorities. For example, some local authorities provide a separate collection for food waste, meaning that food waste controbutes to the overall recycling rate. Others advise that food waste should be co-mingled with other non-recyclable household waste, meaning that food waste does not contribute to the recycling rate. Some authorities do not offer any kerbside collection of glass, instead asking householders to take their glass to a bottle bank. If householders do not have the means to access a bottle bank, they may choose to dispose of their glass waste with the general household waste. Since my analysis relies on available data, variations in local policies or population density might influence the results.
Conclusions
In conclusion, my analysis suggests that local authorities with kerbside sort systems tend to achieve higher recycling rates than those with co-mingled systems. However, where employed well, co-mingled systems do have the potential to achieve high recycling rates. Further research is needed to understand the wide range of recycling rates among local authorities employing the co-mingled system, and to understand what factors are associated with higher recycling rates.