
I haven’t always used star schema data models in Tableau. In fact, up until around two years ago I had never heard of them. At that time, the company I was then working for made a decision to switch from Tableau to Power BI for its self-service business intelligence software. I jumped into a multitude of online learning resources for Power BI (in case you want a recommendation my favourites were the courses offered by Maven Analytics, available on their own platform or through Udemy), and soon discovered the importance of data modeling (and in particular the star schema) for Power BI.
I fell in love with dimensional modelling almost immediately. It appeals to my sense of order and logic. I like they way that like fields are grouped together as entities (dimension/lookup tables) and facts are similarly grouped together (in fact/data tables). I have since read conflicting articles on how dimensional modeling is either the best tool for BI or outdated and unnecessary. So if you’re not a fan, then go ahead and stop reading. But if you are like me, and want to know how to implement this methodology in Tableau, then read on.
The issue
Unlike Power BI, Tableau is not intuitively set up to allow for dimensional modeling. Nevertheless, it is relatively straightforward to set up a simple star schema, with a single, central, fact table and several dimension tables. The issue comes when you want to build a model with more than one fact table connected to several shared dimensions. In fact, Tableau’s official guidance suggests that this is not possible. However, I believe that I have found a workaround.
The multi-fact model
In my School Admissions Dashboard project, the data model I used was a multi-fact star schema with 3 fact tables and several conformed dimensions as illustrated below.
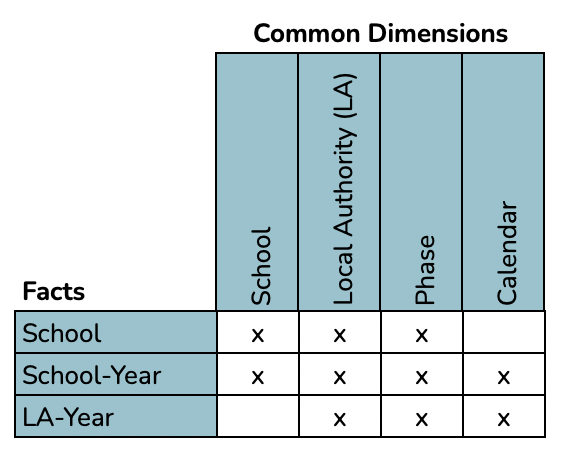
My schema had one fact table which was related to all of my dimension tables (the School-Year fact table). I used this as the starting point for my data model in Tableau. The following steps describe how I then set up the multi-fact model in Tableau Desktop.
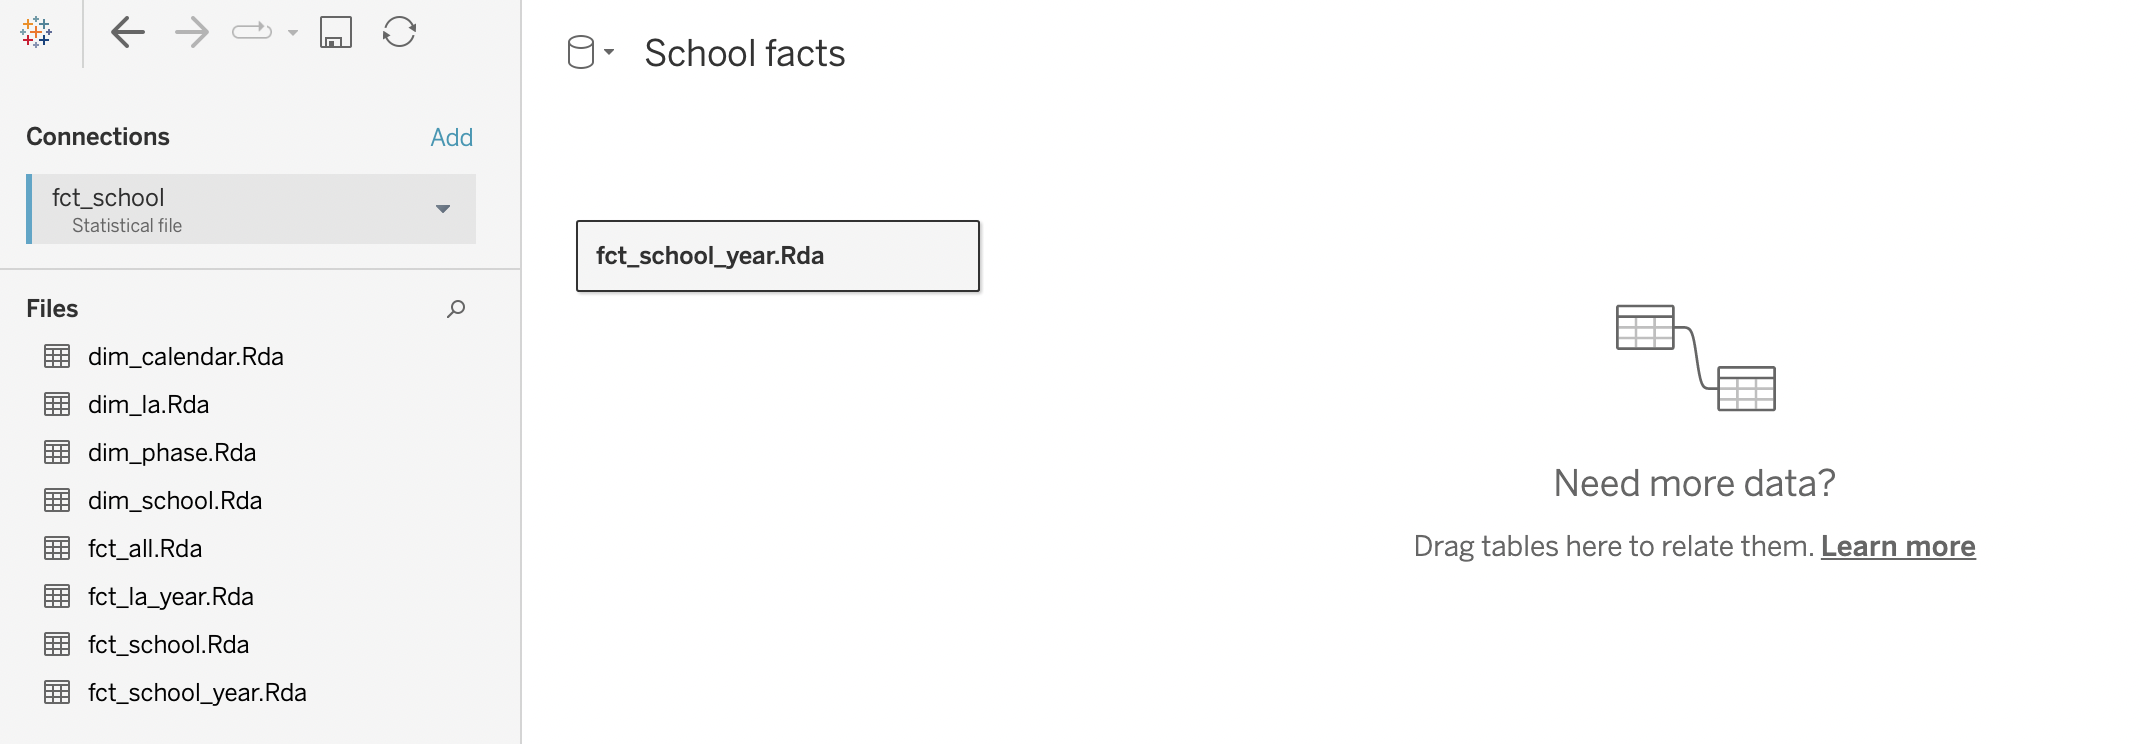
Step 1: Add the first fact table
Add the fact table with the highest number of related common dimensions to the canvas. For me, this was the school-year fact table. Drag this table on to the canvas.
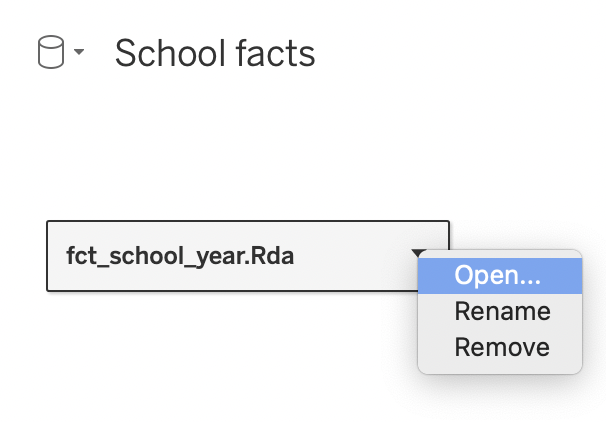
Step 2: Open the fact table to enter the physical layer
Add the conformed dimensions for this fact table as physical layer joins. To do this you need to enter the physical layer of the data model in Tableau.
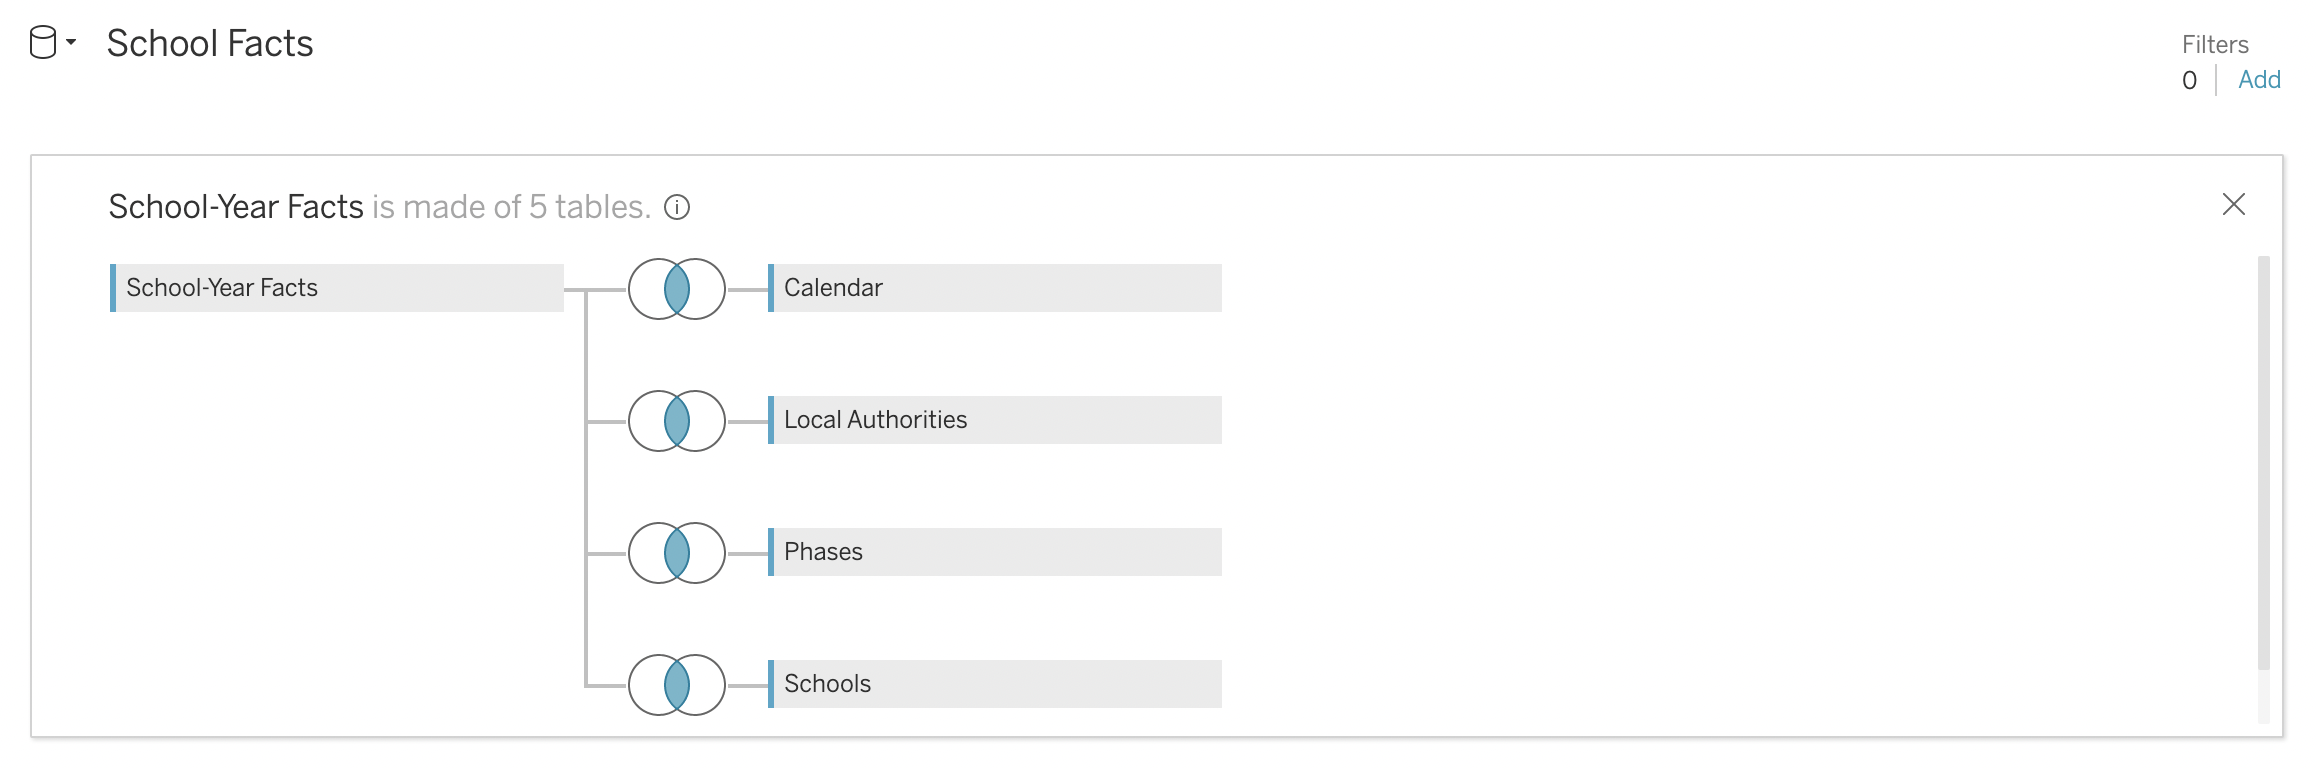
Step 3: Join the dimension tables
Now join each of the conformed dimension tables to the fact table, using whichever join type is most appropriate for your use case. If you’re unsure which join type to use, I suggest to start with an inner join, which keeps only the records that are present in both tables. Once you have done this you can close the physical layer.
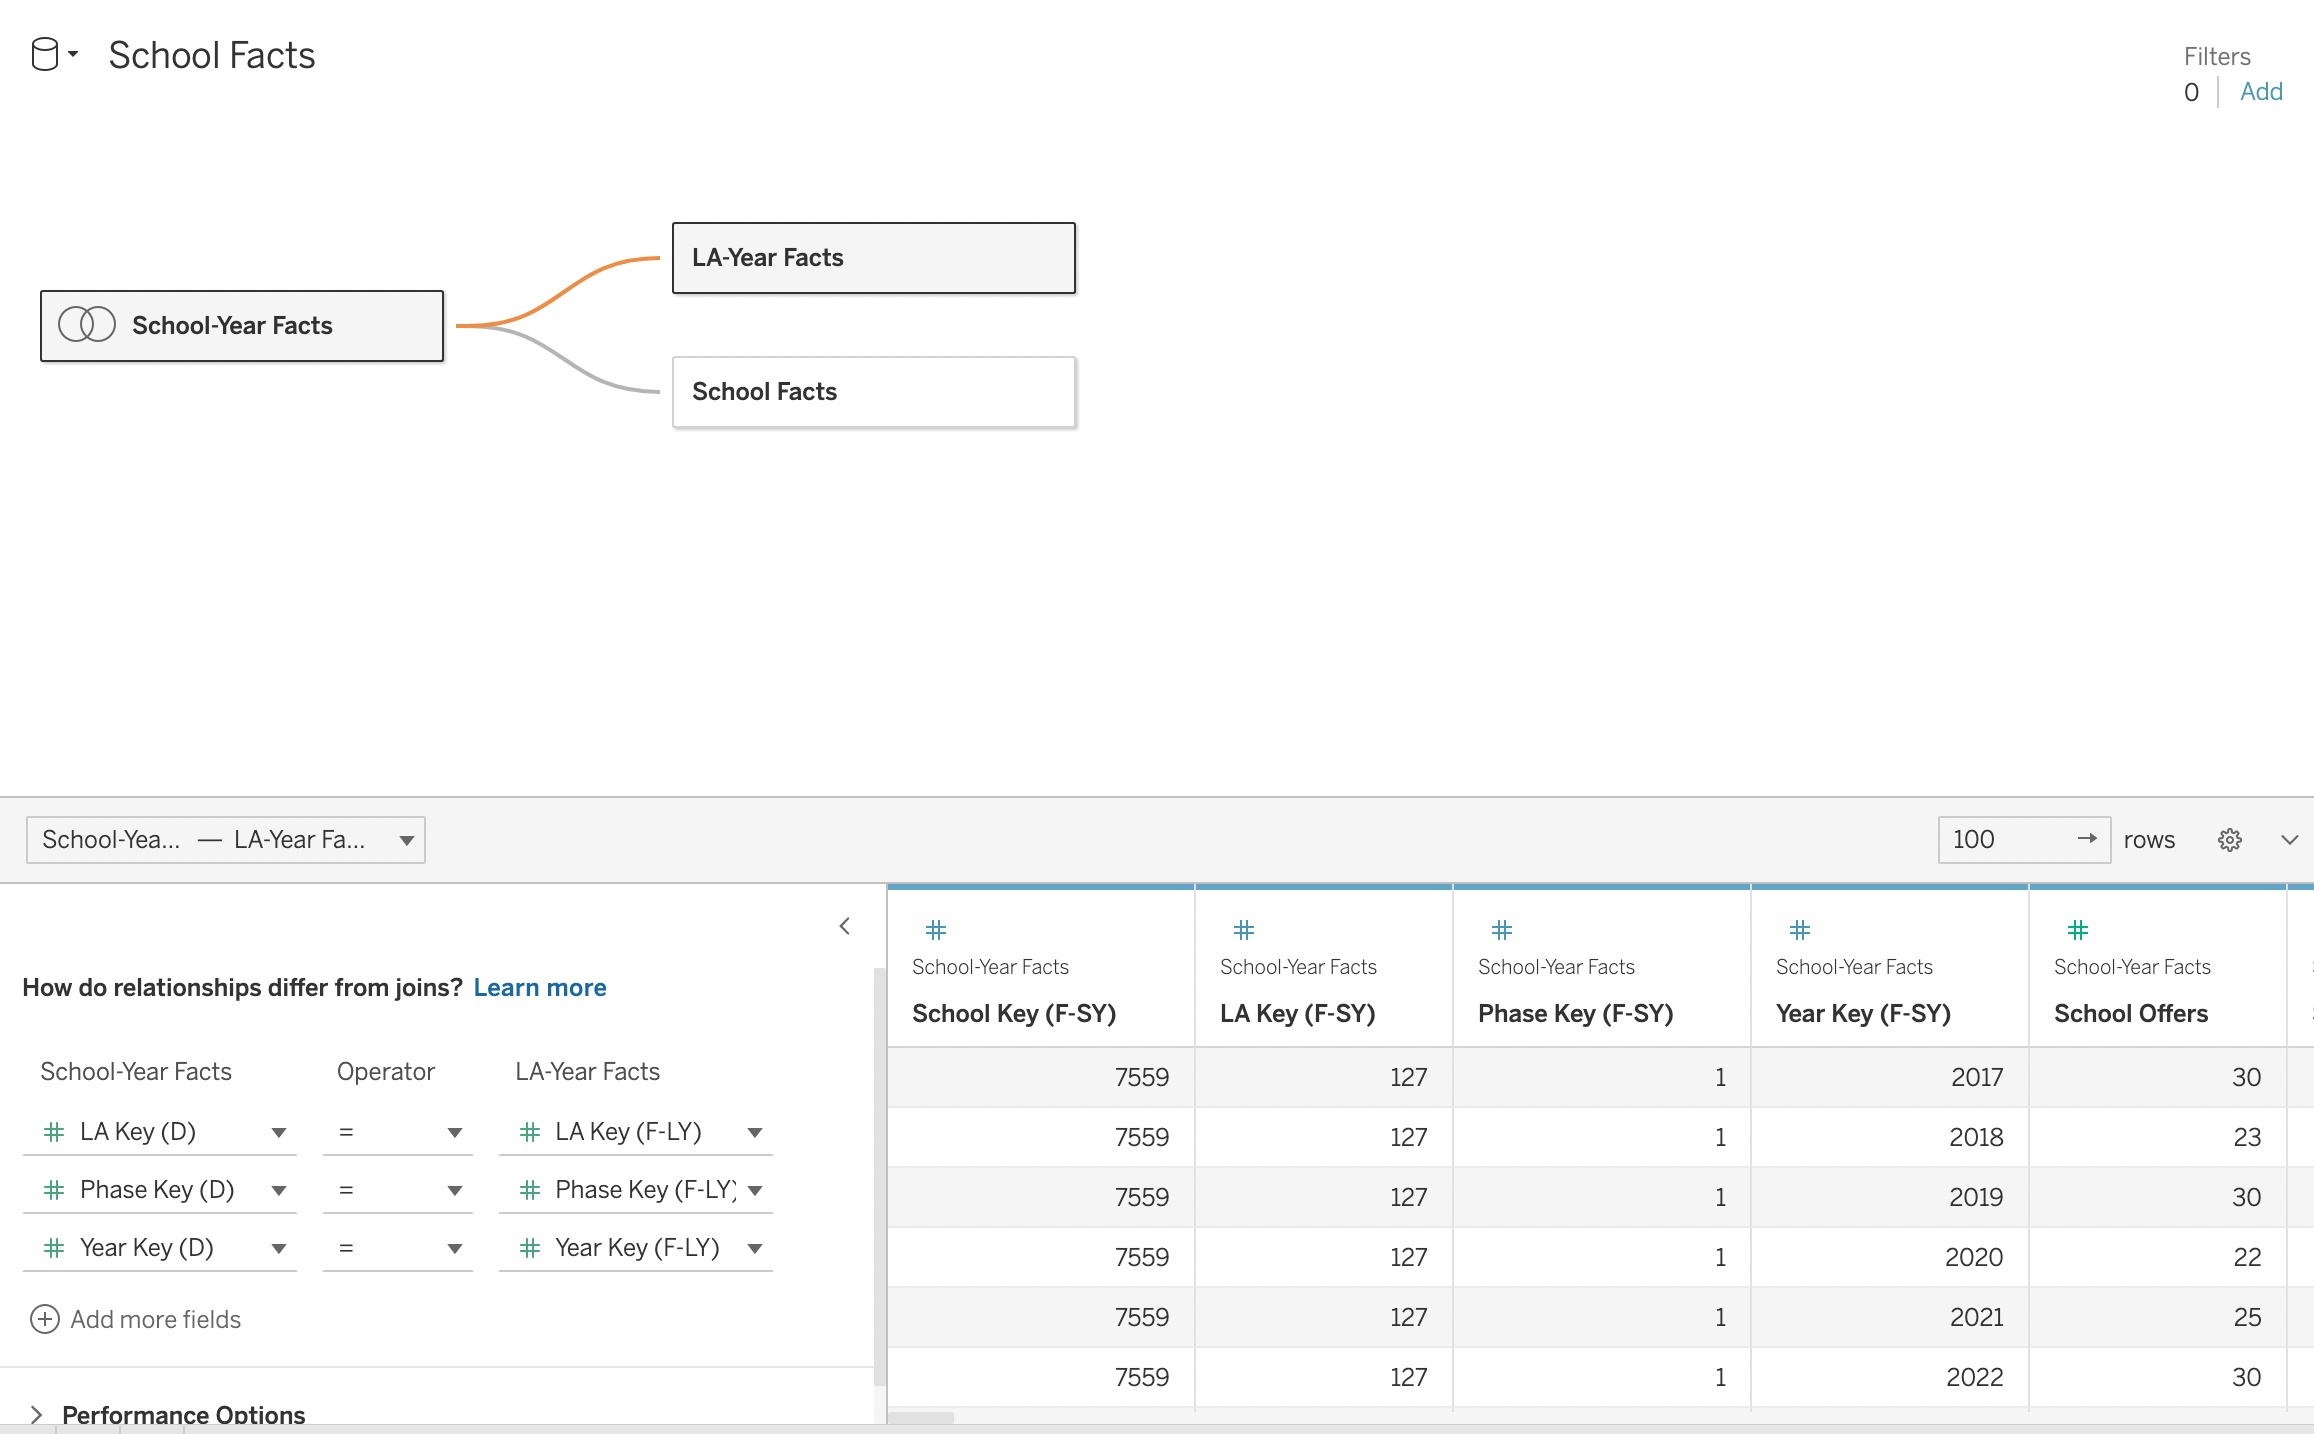
Step 4: Add the remaining fact tables
Back in the logical layer of Tableau, you can now join the remaining fact tables to the first table (which is now a mini data model of its own). You will need to ensure that all of the common keys are joined to each other as shown below.
Step 5: Add any final dimension tables
If your additional fact tables are related to dimensions not already included in Step 3, then you will need to enter the physical layer of that fact table and join the missing dimension tables in the same way as in Step 3.
Summary
And there you have it. This article showed that you can build a multi-fact data model in Tableau that does not require you to have separate data sources with repeated dimensions.