How were school places allocated in England in 2022?
I am pleased to announce that the 2022 edition of my School Admissions Dashboard is now available over on my Tableau Public profile.
The story
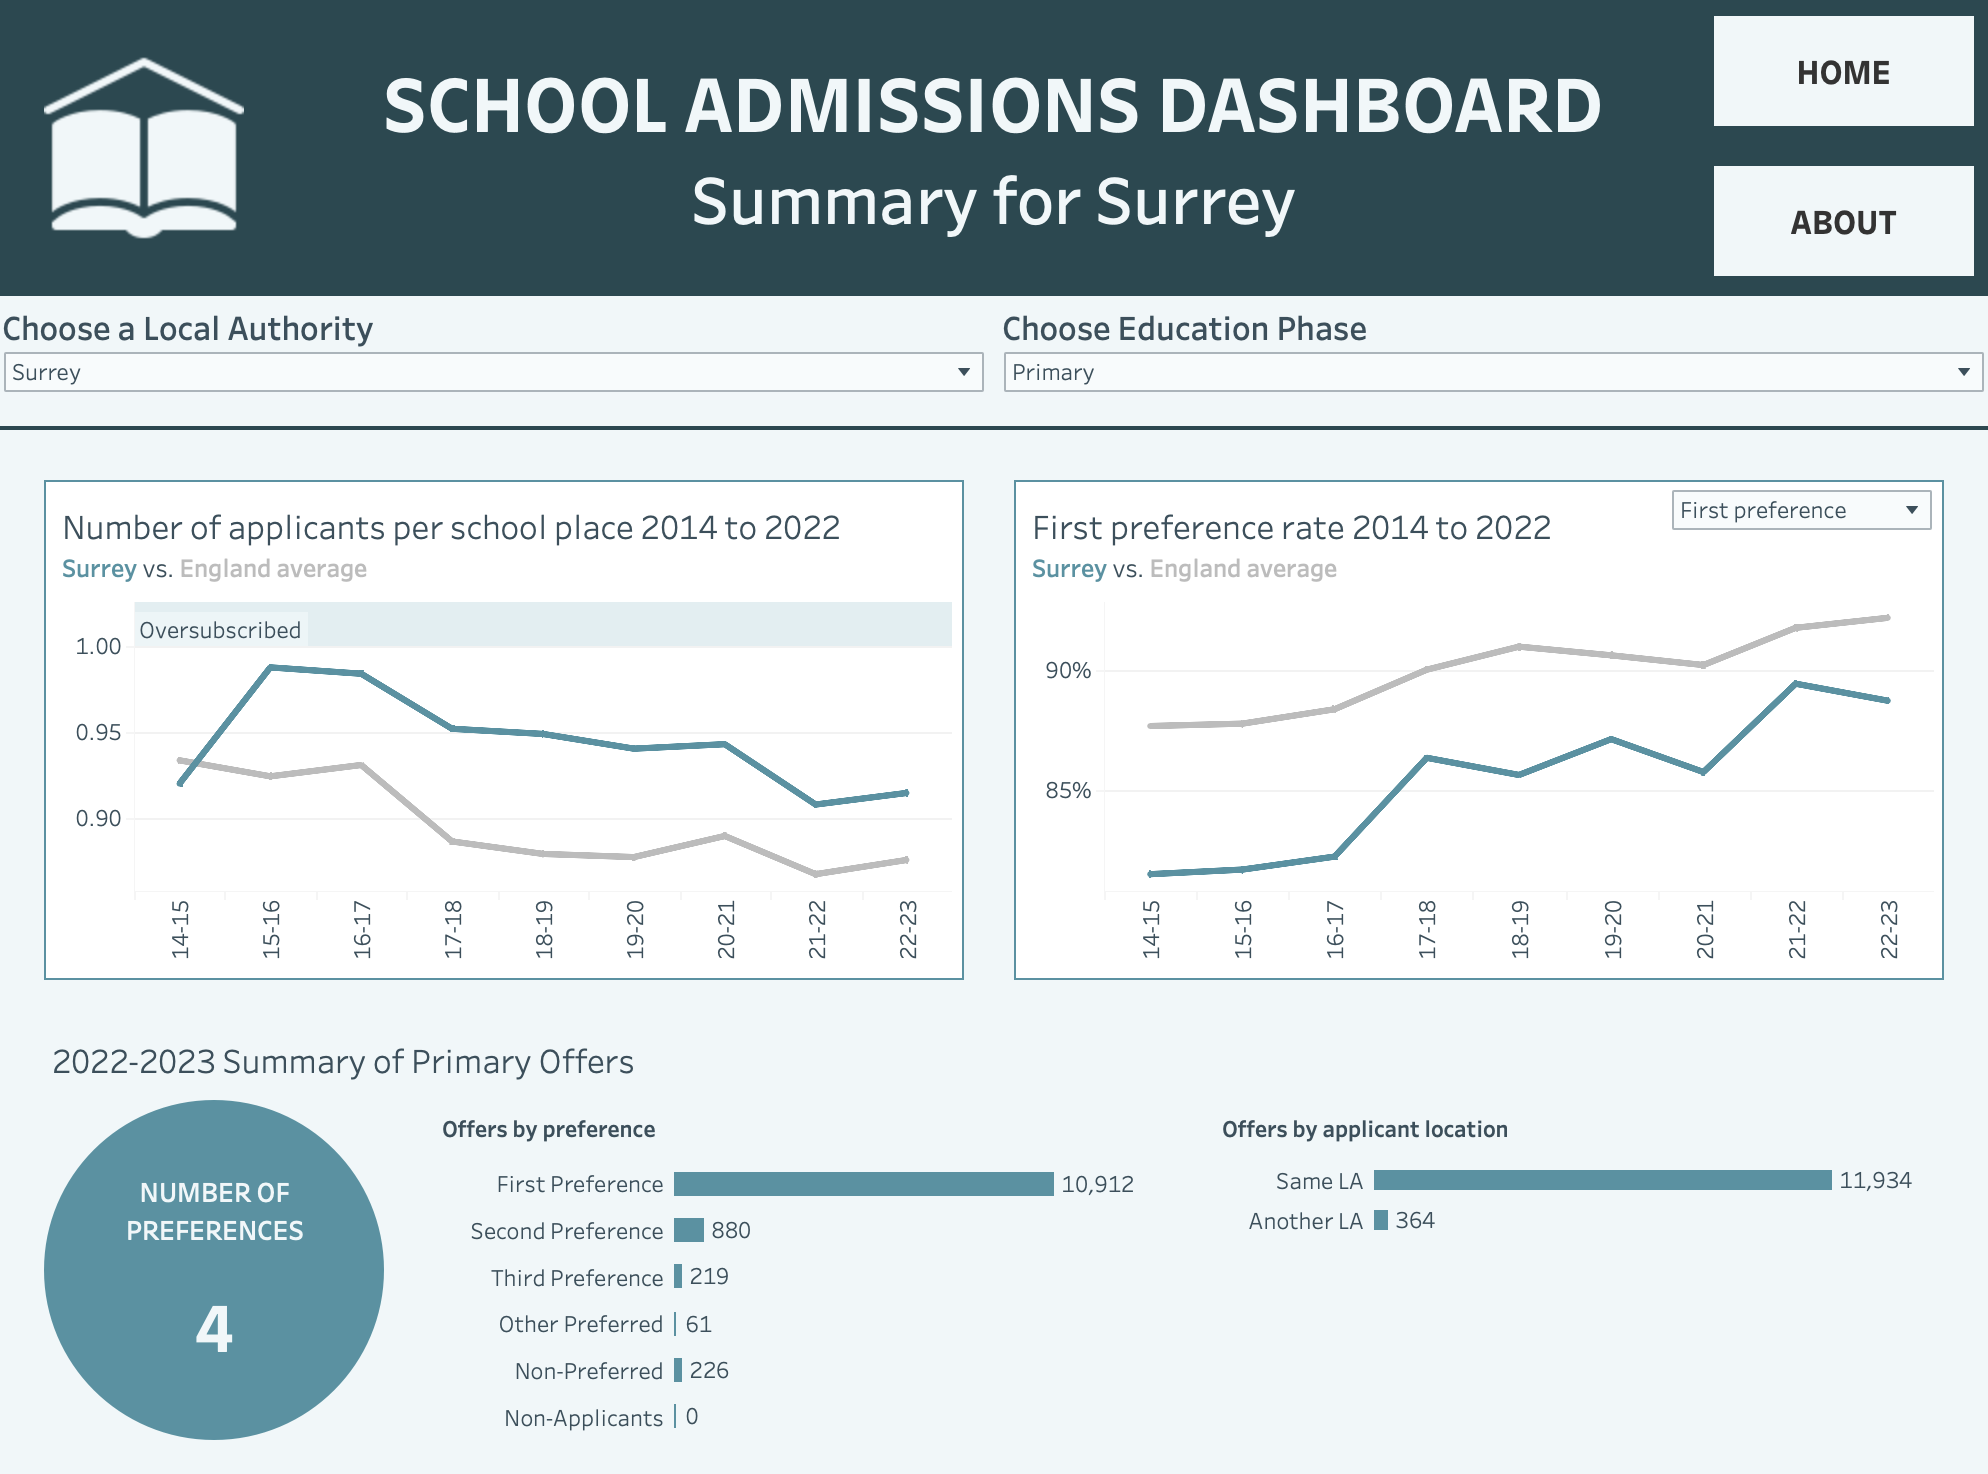
When I prepared the 2021 edition of this dashboard, I was in the thick of it. As a family, we were deciding where to send my son to school. I’m pleased to report that we got our first choice school, as did 89% of parents in Surrey and 92% of parents in England as a whole.
I decided to keep the project going again this year because I am really interested in this data and it’s a great way to develop my data skills. This year, UK Government published full admissions data at the individual school level in a single download (you can download it here if you like). This means I have been able to expand the dashboard to include all local authorities in England, and both primary (Reception Year) and secondary (Year 7) admissions.
On the dashboard landing page, you’ll find headline facts and figures about school admissions for the local authority and phase of education you choose. On the District Details page (click on the DETAILS button at the top right of the screen), you can see a more detailed breakdown of offers and preference rates, as well as performance measures for your selected district. You can further refine your filters to focus on a specific administrative district, town or group of schools of your choice.
I hope that you find this dashboard useful. If you have any questions, feedback or would like to contribute to future editions, please get in touch with me.